What is Super Setup ?

Definition:
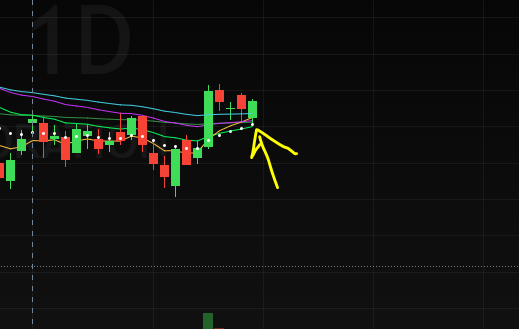
When the daily candle is sitting directly on top of compressed EMAs 8,13,21,34.
In other words, when the daily close is above all these emas, but the low of the day was lower than one or more of these emas.
Example:

SuperSetup*
Is a higher conviction Super-Setup.. along with being SuperSetup the daily volume was higher than the avg daily volume, giving the signal more oomph.
Why EMAs 8,13,21,34 ?
Everyone has their own setup of EMAs or SMAs, I tend to like these because I they are the numbers from fib sequence. For longer term signals, I use 55 and 89 EMAs.
There is no other reason why one ema or better or worse than others. It’s just what I am used to and comfortable with.
Okay But what does it really mean ?
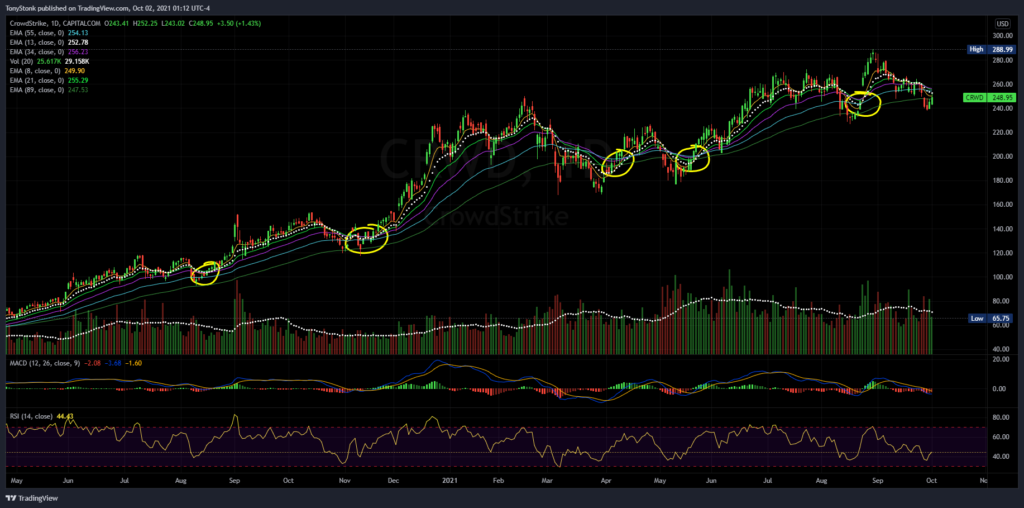
In the chart below for CRWD
All these areas (yellow highlights) where SuperSetups develop, are typically after a pullback and that’s when stock gets to consolidate and EMAs all converge and we get next big move.

Other Tags:
ATR-Crossed-UP: Daily candle crossed the Average True Range ($amount) of the stock in Upward move
ATR-Crossed-DOWN: Daily candle crossed the Average True Range ($amount) of the stock in Downward move
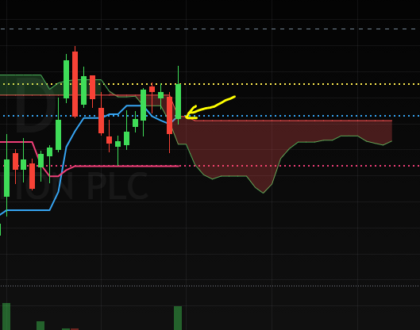
Inside-Cloud : Daily candle close in Inside the Ichimoku Cloud
Below-Cloud: Daily candle close in Below the Ichimoku Cloud
Above-Cloud: Below-Cloud: Daily candles close in Above the Ichimoku Cloud
Active-Sequence: Daily candle close is above EMAs 8,13,21,34,55,89
Active-Sequence-NearTerm: Daily candle close is above EMAs 8,13,21,34
Crossed-Ema[8,13,21,34]-UP: Daily candle close is above EMAs 8,13,21,34 but the Low of the day is under any of these EMAs
Crossed-Ema[8,13,21,34]-DOWN: Daily candle close is below EMAs 8,13,21,34 but the High of the day is above any of these EMAs
Crossed-Ema13-UP: Daily candle close is above EMA 13 but the Low of the day is under EMA 13
Crossed-Ema13-DOWN: Daily candle close is below EMA 13 but the High of the day is above EMA 13
Crossed-Sma[200]-UP: Daily candle close is above SMA 200 but the Low of the day is under SMA 200
Crossed-Sma[200]-DOWN: Daily candle close is below SMA 200 but the High of the day is above SMA 200
Crossed-Sma[50]-UP: Daily candle close is above SMA 50 but the Low of the day is under SMA 50
Crossed-Sma[50]-DOWN: Daily candle close is below SMA 50 but the High of the day is above SMA 50
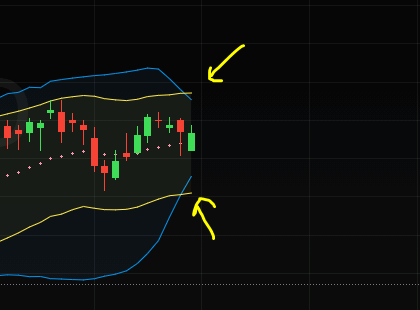
Entered-Squeeze: The Bollinger Bands entered inside the Keltner Channel
Exited-Squeeze: The Bollinger Bands came out of the Keltner Channel
Recommended Posts
Jarvis 101 : Begin your journey
January 11, 2024

What is SqueezedSetup and Squeeze Level % ?
September 24, 2021

What is Bullish Ichimoku Signal ?
September 24, 2021
